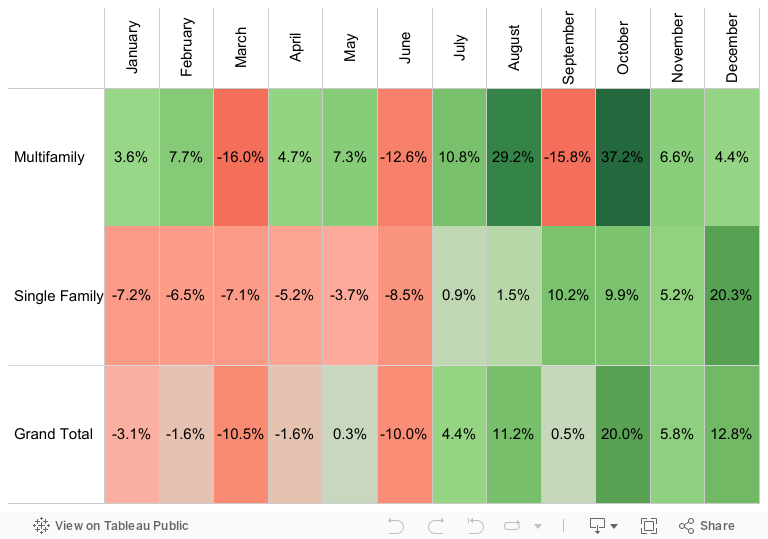
In 2019, more than one million residential building permits were issued in the United States— an overall 2% increase from 2018. Figure 1 shows the year-over-year growth by month for 2019 housing permits.
Figure 1: Year-over-year growth rates by volume by month, 2018 and 2019
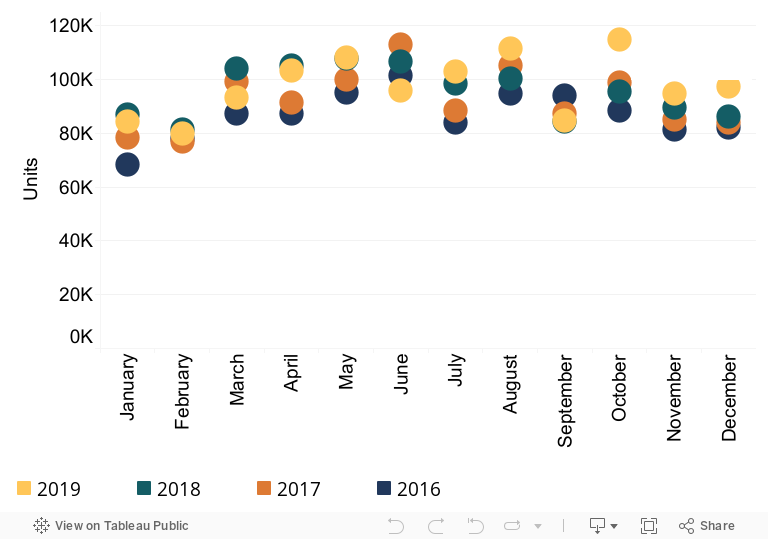
As shown in Figure 2, more than half of these permits were issued during the third and fourth quarters of 2019, compared to the previous three years when the housing market slowed down.The fourth quarter was particularly strong in 2019, growing 13% from the same period in 2018.
Multifamily units saw 15% growth nationally in Q4 2019 compared to Q3 2019, while single family units grew at 11% during the same time period. October experienced particularly strong growth, driven heavily by multifamily.
Single family grew 7.3% when comparing the second half of 2019 with the second half of 2018. Multifamily exhibited stronger growth over the same period, growing at a rate of 12.3%.
Figure 2: Monthly Housing Permits in the United States, 2018-2019
Two potential factors that may have impacted the increase in permit activity in Q3 and Q4 2019 are weather and low interest rates.
Weather
The third and fourth quarters in 2019 were warmer than average, according to NOAA. From July through December 2019, areas of the West, Southwest, Midwest, and Northeast ranked “above average” for regional average temperatures. The Southeast ranked “much above average”, as shown in Figure 3.
Figure 3: NOAA Regional Average Temperature Ranks, July-December 2019
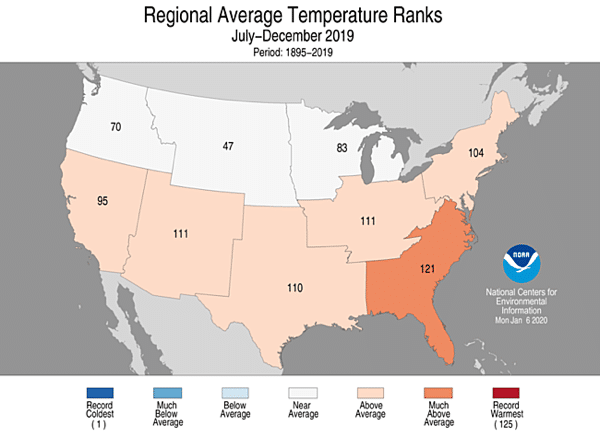
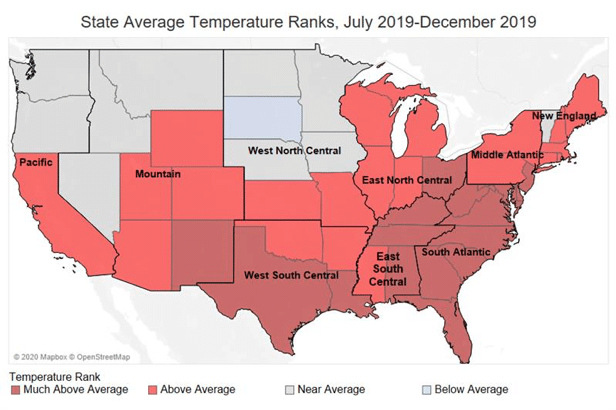
Figure 4 shows the state average temperature ranks from July – December 2019. Above average temperatures were more conducive for construction to continue through the typically colder months. In general, regions with warmer weather are less impacted by warmer fall and winter temperatures as builders are not impacted by frozen ground or snow and ice as typically experienced in northern regions.
Figure 4: State Average Temperature Ranks, July 2019-December 2019
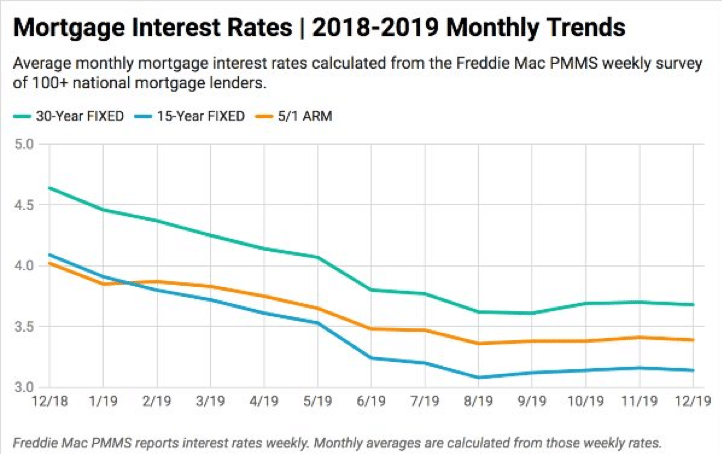
Interest rates
Interest rates steadily declined through 2019 making it easier for homeowners to buy and build homes. Interest rates also impact the housing stock, which has continued to grow, particularly in the second half of 2019.
Figure 5: Mortgage Interest Rates, 2018-2019 Monthly Trends
Principia tracks and analyzes housing permit data in the United States and publishes online interactive dashboards for subscribers. These dashboards allow users to check monthly progress and compare data from prior time periods.
For more information about Principia’s data and available dashboards, contact us today.