What Builders and Contractors Value Most in LBM Dealers
Reliable Insights from a MaxDiff Study of Builders and Contractors
Principia continually fields surveys with participants across the value chain as a leading market research and advisory services firm focused on the building and construction industry. This article focuses on insights from our monthly survey of builders and contractors conducted between June 2024 and April 2025.
The purpose of this article is twofold:
- Detail what is most important to builders and contractors when choosing a lumber and building materials (LBM) dealer to do business with
- Share how our methodology for producing these insights may be superior to other survey methods employed in monitoring the building materials space
Key Insights: What Matters Most
Construction pros have choices when deciding where to buy their building materials. So how do they decide where to buy? When considering a long list of dealer service offerings, the results (in order of importance) are provided below.
Figure 1: Dealer Service Offerings Ranked by Importance to Builders and Contractors
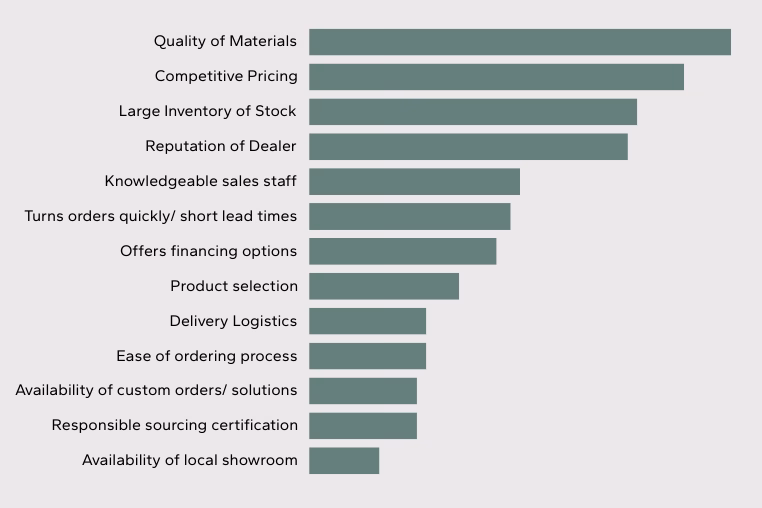
What’s missing from Figure 1 is a numeric score to indicate how closely one factor compares to the others. We purposefully removed the scores, but we’ll provide them shortly.
However, it is important to first examine the strengths and weaknesses of differing methodologies to determine how importance scoring should be best calculated for our stated purpose here.
Methodologies with Limitations
The most common methodologies that market research surveys employ when attempting to develop a score between one attribute versus another are “forced rating” or “rank order” questions.
- Forced Rating: Forced rating asks respondents to rate each attribute or feature independently on a predefined scale.
- Rank Order: Rank order asks respondents to rank a list of attributes or features in order of importance.
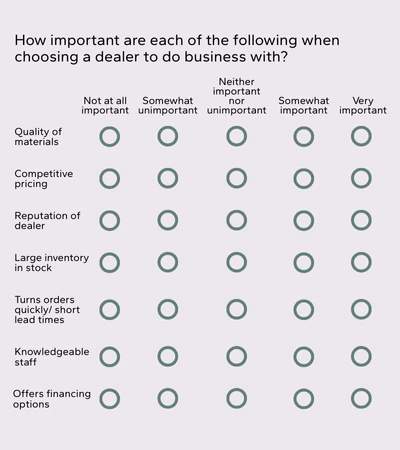
Forced Rating
While this method certainly produces a score indicating level of importance by attribute or feature, using forced ratings can also lead to consistent ratings across all factors, resulting in narrow delineation between scores. This is because the attributes are not being judged against each other, but only on their own merits, another drawback of this type of question.
An example of forced rating is provided to the right.
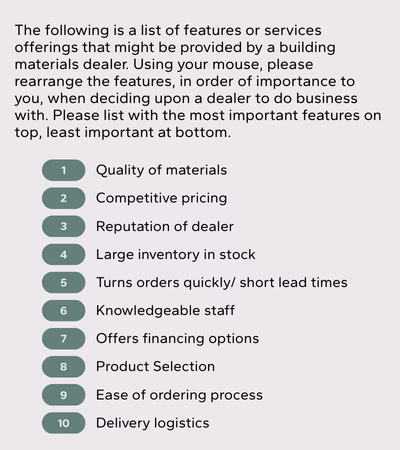
Rank Order
Rank order questions ask respondents to take a list of features and order all of them from most important to least important. It is a sufficient method for testing smaller list of attributes or features. However, if we attempt to do this with a larger list of items (like our list of 13), it is exceedingly difficult for respondents to consider a multitude of factors against each other.
Moreover, this methodology would be all but impossible if administered over the phone, making it suitable only for online surveys. Respondents simply cannot memorize 13 attributes that have been read to them, then judge them fairly.
On the right is an example of a Rank Order question.
MaxDiff — A Superior Methodology for Ranking Features or Attributes
So, what is MaxDiff, and what makes it worthy of discussion here? While MaxDiff (Maximum Difference Scaling) is under-utilized by many market researchers, it is generally considered superior when attribute differentiation is a key outcome.
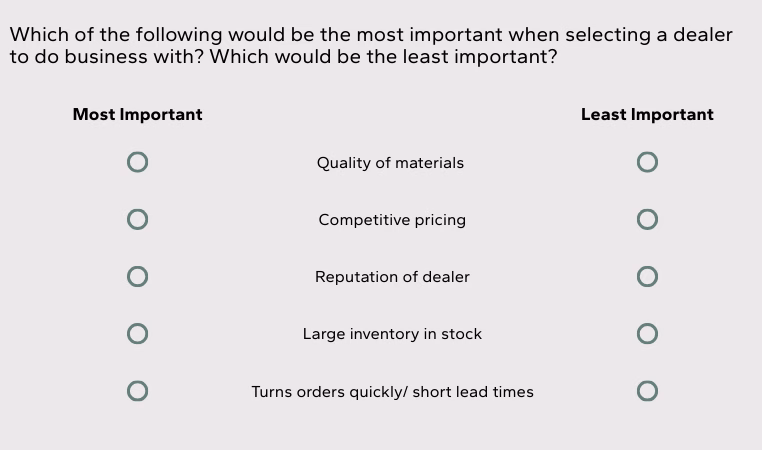
Rather than attempting to produce scores using a single question, MaxDiff presents respondents with small and randomized subsets of features from the full list, then asks them to pick the most important and the least important from that subset. This process is then repeated multiple times with different subsets to ensure each attribute has been graded against all others sufficiently to produce the desired statistical reliability. Think of it like a single ranking question broken down into more easily digestible pieces.
This approach is particularly useful when dealing with a large list of attributes or factors (like ours here). MaxDiff simplifies the data gathering by limiting the choice to just four or five attributes at a time, making it far easier for the respondent to grasp and score.
Below is an example of how MaxDiff questions are presented to respondents, then repeated multiple times with differing, randomized attribute sets.
MaxDiff Output
After collecting responses, we are left with a large data set containing all their choices. There are 3 ways in which we can analyze the data:
- Counts Analysis: Shows the percentage of times a feature was selected as most or least important.
- Utility Score Analysis: Indicates the relative importance between features.
- Preference Share Analysis: Calculates the probability that one feature would be chosen over another.
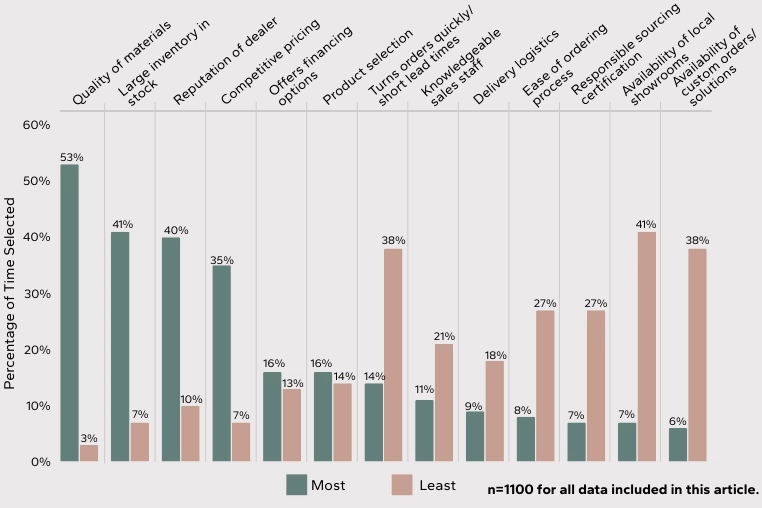
Counts Analysis
The simplest way to digest this large data set is by performing a counts analysis, which details the percentage of time a feature was selected as most or least important (when it was shown). In the chart below, the most and least important are indicated in green and mauve, respectively.
Quality of Materials (closely followed by Competitive Pricing) received the greatest number of votes as “Most important”, while Availability of local showrooms received the greatest number of votes as “Least important” when shown to builders and contractors.
Figure 2: MaxDiff Counts Analysis of Features
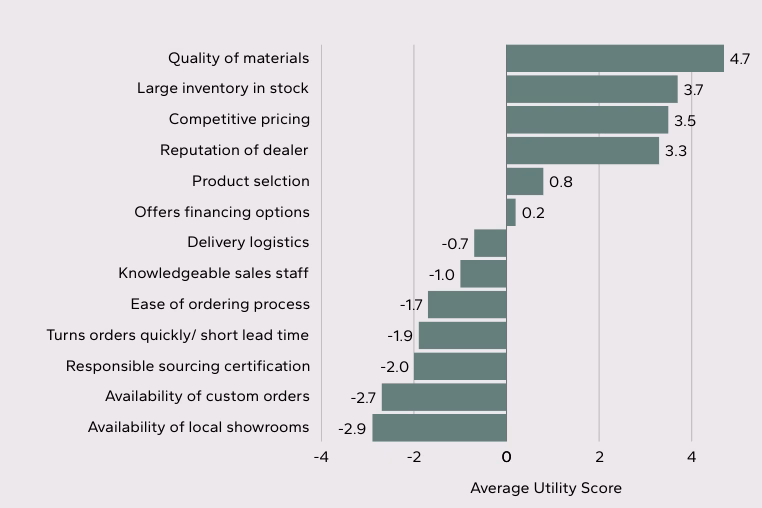
Utility Score
A slightly more complex method of analyzing the data is to calculate the average feature utility score of each factor, which indicates the relative importance between features. Higher utility values indicate greater importance, lower utility values indicate less importance. When ordered by these values, features which merit focus rise to the top of the list and those that need less attention will fall to the bottom.
The individual utility score is calculated by estimating the probability a factor would be selected based on its utility or overall value. This analysis gives some directional understanding but should not be a standalone metric to summarize findings.
Important to Note: Though a feature can be at the bottom of the list or attain a low utility score, it does not indicate the feature is of “no importance”. Rather, the feature was considered not as important to respondents when presented with other options among the larger list.
Figure 3: MaxDiff Utility Score by Feature
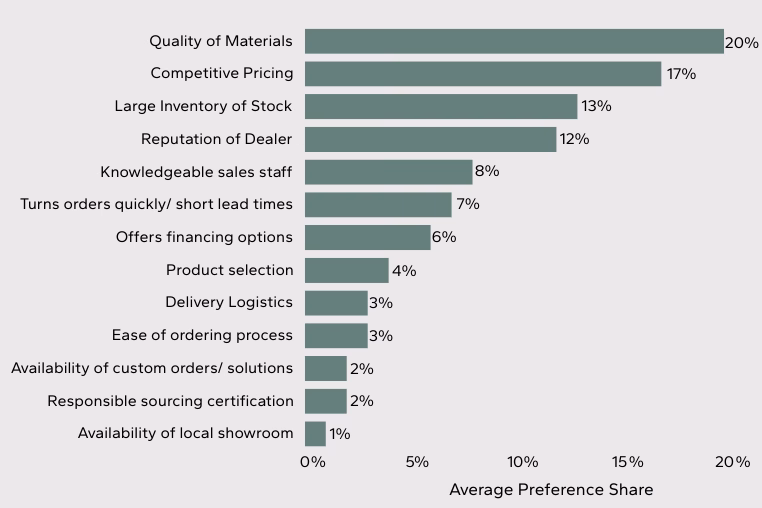
Preference Share
Finally, the optimum way to interpret the findings is by calculating preference share, or the probability that one feature would be chosen over another when respondents are asked to select the best from all options.
Preference shares sum to 100% and can be understood as the likelihood the attribute truly is the most preferred item, and by how much. The following is the same chart we presented at the beginning of this article, with preference share scores included.
Figure 4: MaxDiff Preference Share by Feature
Conclusion
MaxDiff methodology offers a superior approach to understand what builders and contractors value most in LBM dealers. By presenting respondents with small, randomized subsets of features, MaxDiff ensures each attribute is evaluated against all others, providing statistically reliable and nuanced insights. This method stands out from traditional forced rating and rank order techniques, which often fail to capture the true differentiation between attributes.
Partnering with Principia means leveraging our extensive expertise in the building and construction industry. Our commitment to conducting thorough and insightful research, as demonstrated in our monthly surveys, ensures that you receive actionable data to drive strategic decisions. Principia partners with you to transform complex data into clear strategic advantages helping your business thrive in a competitive market.