HOA Restrictions Impact Nearly 1 in 4 Homeowner’s Product Choice
Homeowners can provide valuable perspective as the end user for residential building products. Digging into their purchasing behaviors and influences can lend informative insights to building product manufacturers. Most recently Principia evaluated survey results from 7,000 homeowners on the restrictions placed on their purchases by their homeowner association (HOA). The results are interesting.
Figure 1: Does your home or neighborhood have restrictions on the types or materials of building products you can choose to install for home improvement projects?
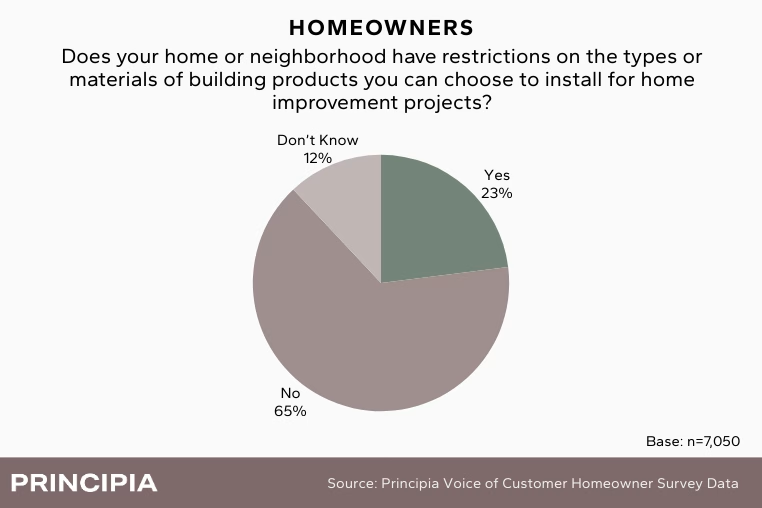
As shown in Figure 1, a majority (65%) of our homeowner sample do not face any restrictions on the type or material of building products they can install. That leaves nearly a quarter of surveyed homeowners living under restrictions that limit their choices for home improvement materials. For homeowners that reside in an area with restrictions, we wanted to learn more about which exterior product categories are most affected.
Figure 2: Which exterior product categories have a neighborhood restriction impacting your choice on what you can or cannot install?
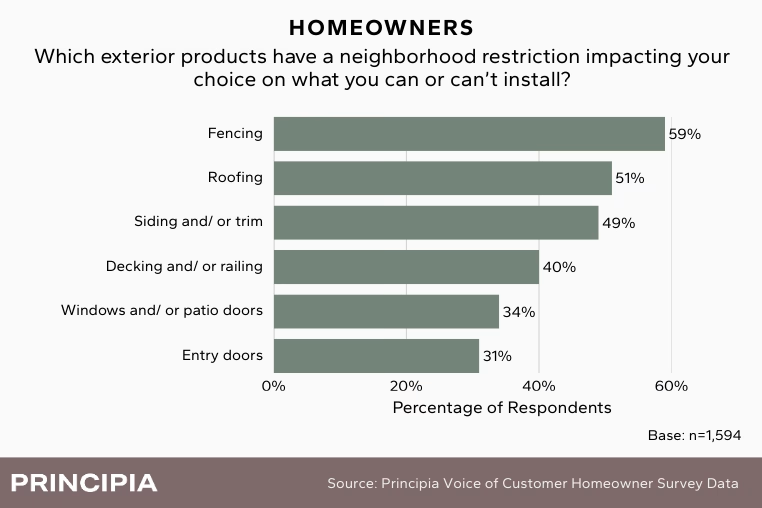
Over half of homeowners with restrictions face limitations on the type of fencing (59%) and roofing (51%) that can choose to be installed. Siding and exterior trim tracked closely behind.
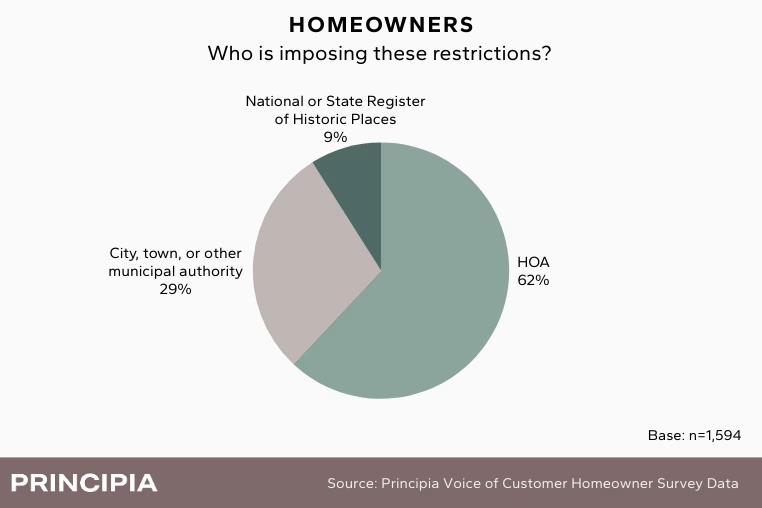
As shown in Figure 3, HOAs (62%) are the most common enforcer of these product restrictions. Interestingly, over 1/3 of homeowners face restrictions not from their HOA, but from other entities such as their town or a Register of Historic Places.
Figure 3: Who is imposing these restrictions?