The relative position in the new construction business cycle is a topic of constant discussion within the building materials industry and used as an indicator of the market’s overall health. The long-term historical average of 1.5 million housing starts annually is a common reference point when gauging how much additional upside remains in the cycle.
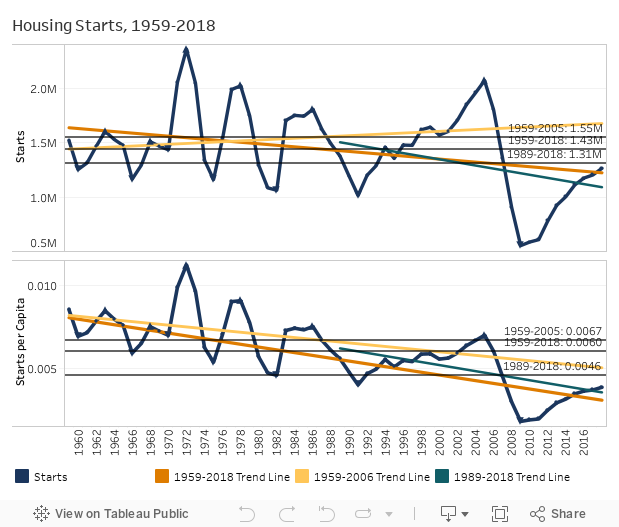
From 1959 (the first year of data available from the U.S. Census) through the 2005 housing peak, starts averaged 1.55 million per year. However, the average number of annual starts over the entire 60-year period available is 1.43 million, with the most recent 30 years having only averaged 1.3 million per year. In addition, starts and starts per capita have been trending downward across 30- and 60-year periods.
Two clear observations were identified through Principia’s housing starts analysis from 1959 through 2018:
- A clear downward trend, which is particularly pronounced in housing starts per capita.
- Most recent U.S. Census numbers are above both the 30- and 60-year trend lines.
Clear Downward Trend
Both total and per capita starts have a statistically significant negative correlation with time. A persistent downward pattern in the peaks and troughs is also evident for both measures; the last four peaks and five troughs in starts per capita are lower than their precedent. Starts per capita even show a downward trend when only looking at data up until the 2005 peak, serving as evidence that this trend extends prior to the recent downturn. Total starts between 1959–2005 show a slight upward trend but were not significantly correlated with time.
Current Housing Starts Data
As of 2018, housing starts are very close to their 30-year average of 1.3 million, and above trend lines implied by linear regression over the last 30 and 60 years. The current expansion has also lasted longer and has been larger in magnitude than any in the data aside from 1991–2005. This does not necessarily indicate that a downturn is impending immediately—recent cycles have seen a few years of growth after crossing the trend line. In addition, this is just one metric and other indicators point to conditions of undersupply existing in much of the US. However, it does suggest the need for some caution when projecting how much room remains for growth.
Other Considerations
An important caveat to drawing conclusions from this data is that it is hard to determine how irregular the most recent cycle was, and the extent to which that irregularity is skewing the 30- and 60-year trend lines downward. The contraction was certainly more extreme than any other in the available data; starts lost 73% of their value in comparison with 51% (1972–1975), 48% (1978–1982), and 44% (1986–1991) in prior contractions. However, the cycles in the 1970s and 1980s were by no means moderate—and although the expansion prior to 2005 was larger in magnitude than any preceding cycles, the rate of change was lower. In fact, the recent expansion has seen a higher CAGR (9.6%) than the 5.3% growth between 1991 and 2005.
Whatever length of runway remains for the current expansion, the decline in starts per capita seems to be a long-term trend predating the recent recession. Principia will explore the causes and consequences of this apparent trend further in the coming weeks. Up next we will consider historical data on the housing stock, how its trend compares with starts, and the ramifications for the relative importance of new construction and remodeling.