Net Manufacturer Revenue vs. Revenue Per Location
United States dealers sold $9.6 billion of residential siding products in 2019. This included $7.6 billion in net manufacturer revenue and yielded a total channel margin of $2 billion. The number of dealer locations selling residential siding totaled about 20,000 throughout the U.S in 2019.
Siding distribution tends to vary by siding material with brick sold direct through masonry yards, vinyl siding sold direct to specialty one-step dealers, and heavier products such as fiber cement or engineered wood more typically going into two-step distribution and then on to lumberyards. Overall, 59% of siding is sold direct and 29% goes into two-step distribution.
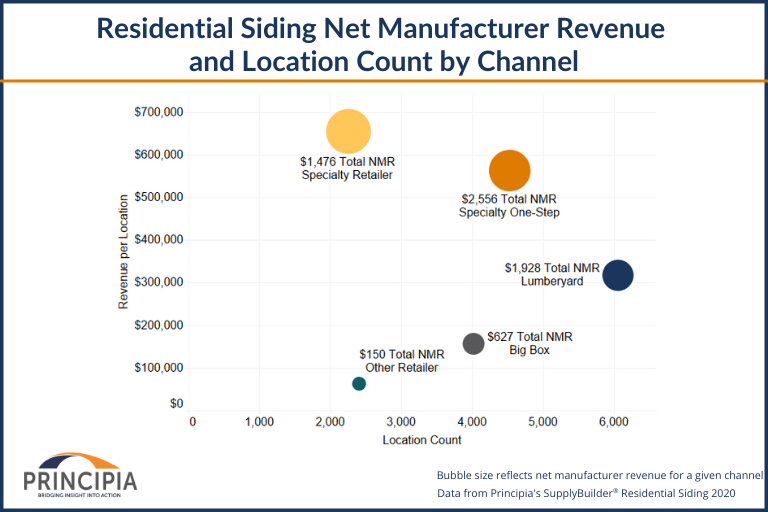
Figure 1 provides net manufacturer revenue by channel along with location counts by channel from Principia’s dealer locator database. The bubble size reflects net manufacturer revenue for a given channel. For example, specialty one-step dealers sell about $2.5 billion of siding products from just over 4,500 locations, yielding an average revenue per location of just over $600,000.
Figure 1: Net Manufacturer Revenue & Location Count by Channel
Channel Comparison
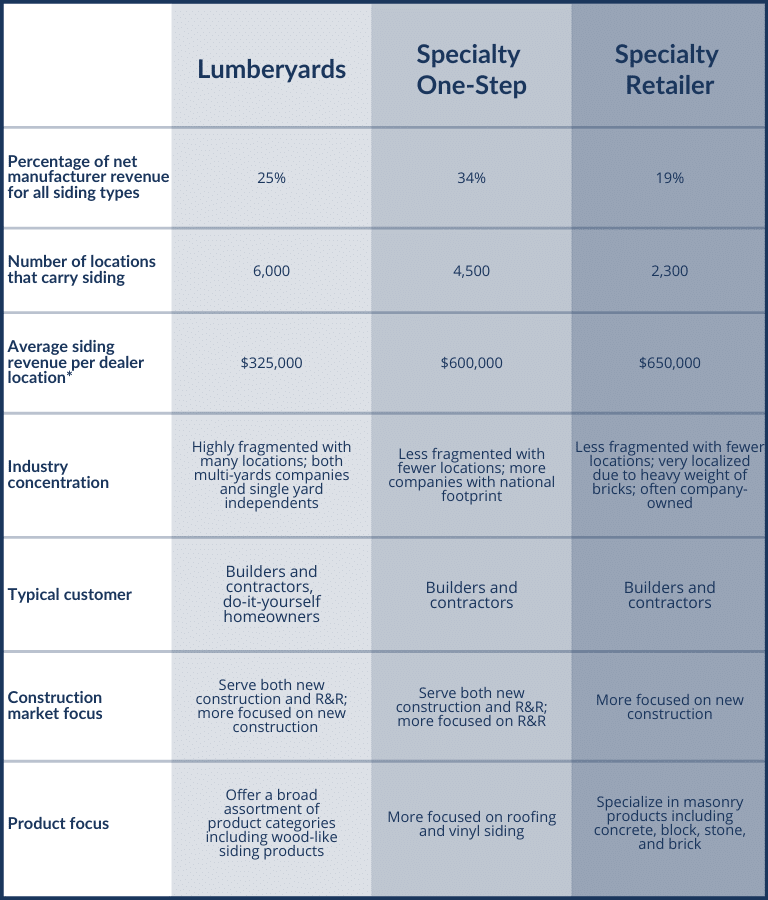
Figure 2 provides a comparison of lumberyards, specialty one-step, and specialty retailers for residential siding distribution. Specialty one-step and lumberyard are the leading retail channels for siding distribution based on total net manufacturer revenue for all siding types. Specialty one-step accounts for 34% of product sold while a total of 25% of siding is sold from lumberyards.
Specialty retailers (also known as brick yards or masonry yards) account for a lower share of market revenue at 19%, but have the highest average revenue per location of $650,000. The specialty one-step channel sells an average of $600,000 revenue per location while lumberyards have the largest number of locations but have a much lower average revenue per location at $325,000.
Figure 2: Channel Comparison for Siding
What does this mean for manufacturers?
Given the siloed nature of siding distribution, certain siding products are more conducive to certain channels, but in developing a more diversified channel strategy, manufacturers can look at both product revenue by channel and the number of locations to gain insight helpful in refining their channel strategies.
For instance, while lumberyards tend to have a lower average revenue per location, the sheer number of distribution outlets is helpful in increasing reach within a market. Or, the higher siding revenue per location among specialty one-steppers is especially appealing when considering the benefits of selling to fewer, larger customers that often place product across multiple markets because the companies are more nationally focused.
Principia can help industry participants use this information to support their business initiatives. More information about residential siding supply and distribution is available for purchase in four product offerings designed to meet your specific needs: Product Supply Snapshot, LBM Dealer Locator, SupplyBuilder®, and BuilderSeries®.
For more information about Principia’s supply and distribution products for residential siding, contact us today.